Simple Stresses
Learning Objectives
- Distinguish normal, shear, and bearing stress and apply the correct resisting area.
- Interpret tension and compression signs consistently in architectural members.
- Explain Saint-Venant's principle and the limits of average-stress models.
- Evaluate direct stress produced by restrained thermal deformation.
- Relate calculated stress to material strength through an explicit factor of safety.
Normal Stress
Normal stress is the axial force per unit area acting perpendicular to a cross-section. Tension is commonly taken as positive and compression as negative.
Average Normal Stress
Average direct stress in a prismatic member under concentric axial load.
Normal Stress Interpretation
For a concentric load, the average stress model is appropriate away from load introduction regions and geometric discontinuities. The resisting area must be the actual net area that transfers the axial force . For members with holes or cutouts, using gross area can unconservatively understate the stress.
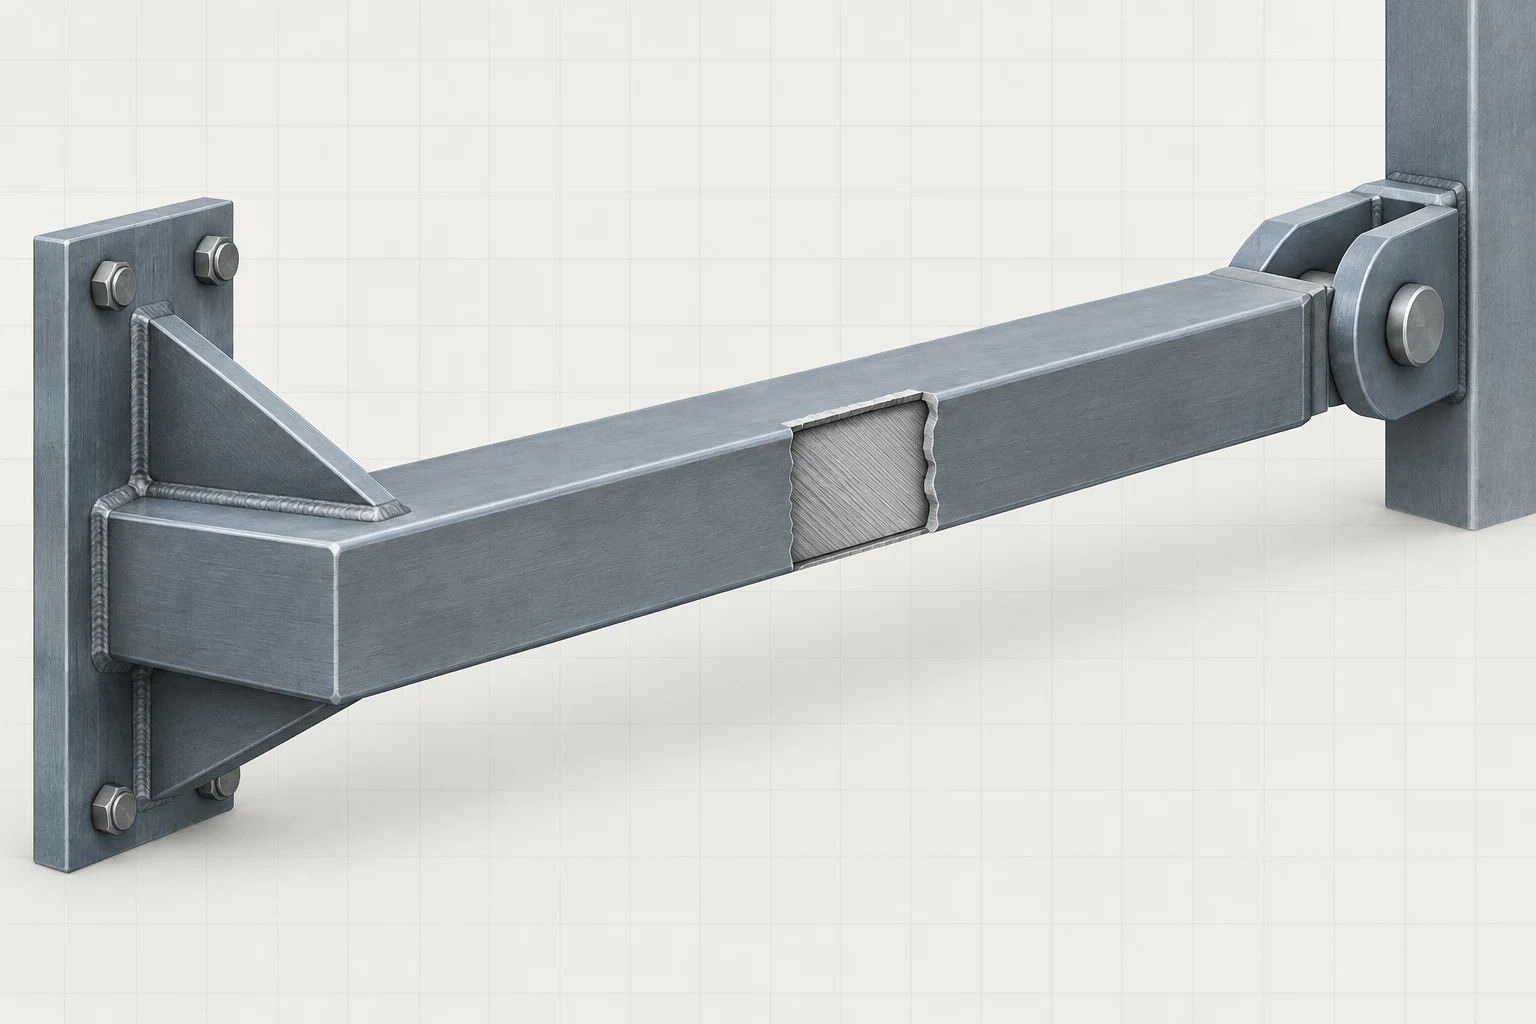
Axial Member Section
The cutaway makes the continuous member and its resisting cross-section visible; use the adjacent formula for average stress rather than reading a stress field from the image.
Reading the Member Section
The section reveal shows where an axial member carries force through its solid area. It is a qualitative context image, not a scaled section or stress-distribution plot; use the actual net area and load-introduction conditions in the lesson's equation.
Interactive Exploration
Change the axial force, member radius, and loading sense in the normal-stress visualizer. Observe that stress varies linearly with force but inversely with cross-sectional area.
Controls
A = πr²
Positive by the selected convention.
Use a separate strength criterion to judge adequacy.
Direct Shear Stress
Direct shear stress is the average tangential force per resisting shear area. Connections may have one or more shear planes.
Average Direct Shear Stress
Average shear stress on one or more resisting shear planes.
Single and Double Shear
For a bolt in single shear, . For a pin or bolt in ideal double shear, . The physical connection geometry determines the number of effective shear planes; it must not be assumed from the member count alone.
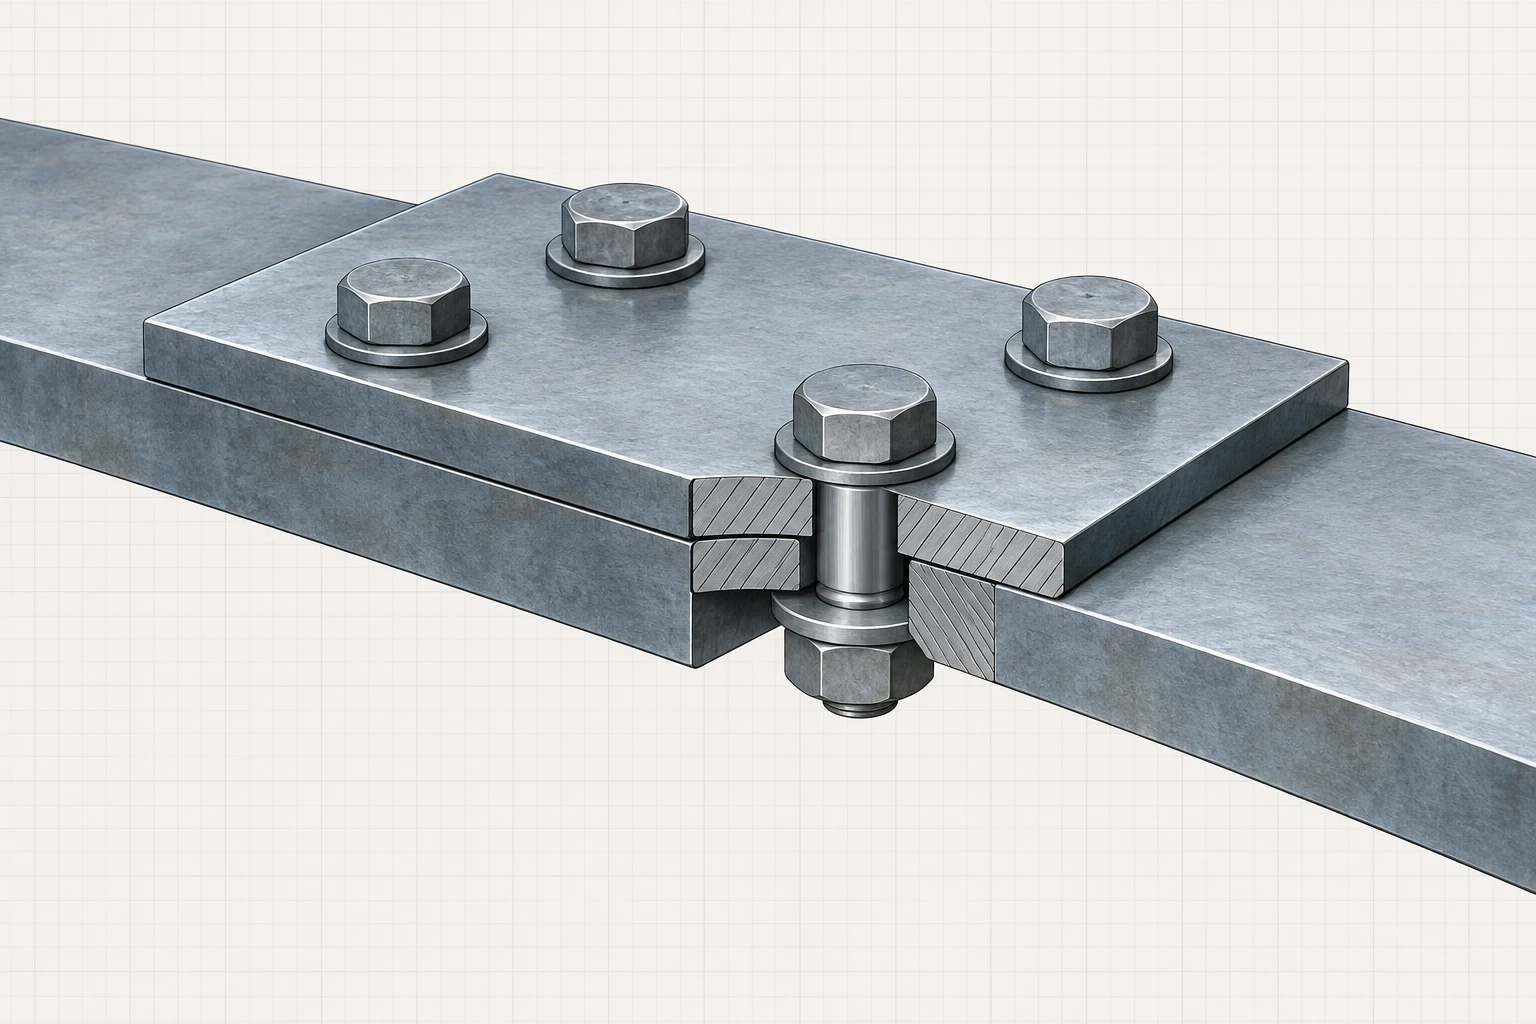
Connection Stress-Transfer Context
Use the connected plates, bolt shank, and hole contact as a physical context for normal, shear, and bearing stress; use the adjacent equations for exact resisting areas and shear-plane counts.
Reading the Connection Context
The cutaway gives a qualitative place to look for stress transfer: the plates carry axial force, the bolt shank transfers transverse force across the joint, and contact develops between the bolt and the hole wall. The image is not to scale and does not decide whether the connection is in single or double shear; use the actual connection geometry and the formulas above for those determinations.
Bearing Stress
Bearing stress is the average compressive contact stress between two connected surfaces, such as a bolt and the wall of a plate hole.
Average Bearing Stress
Projected bearing stress for a pin or bolt bearing on a plate.
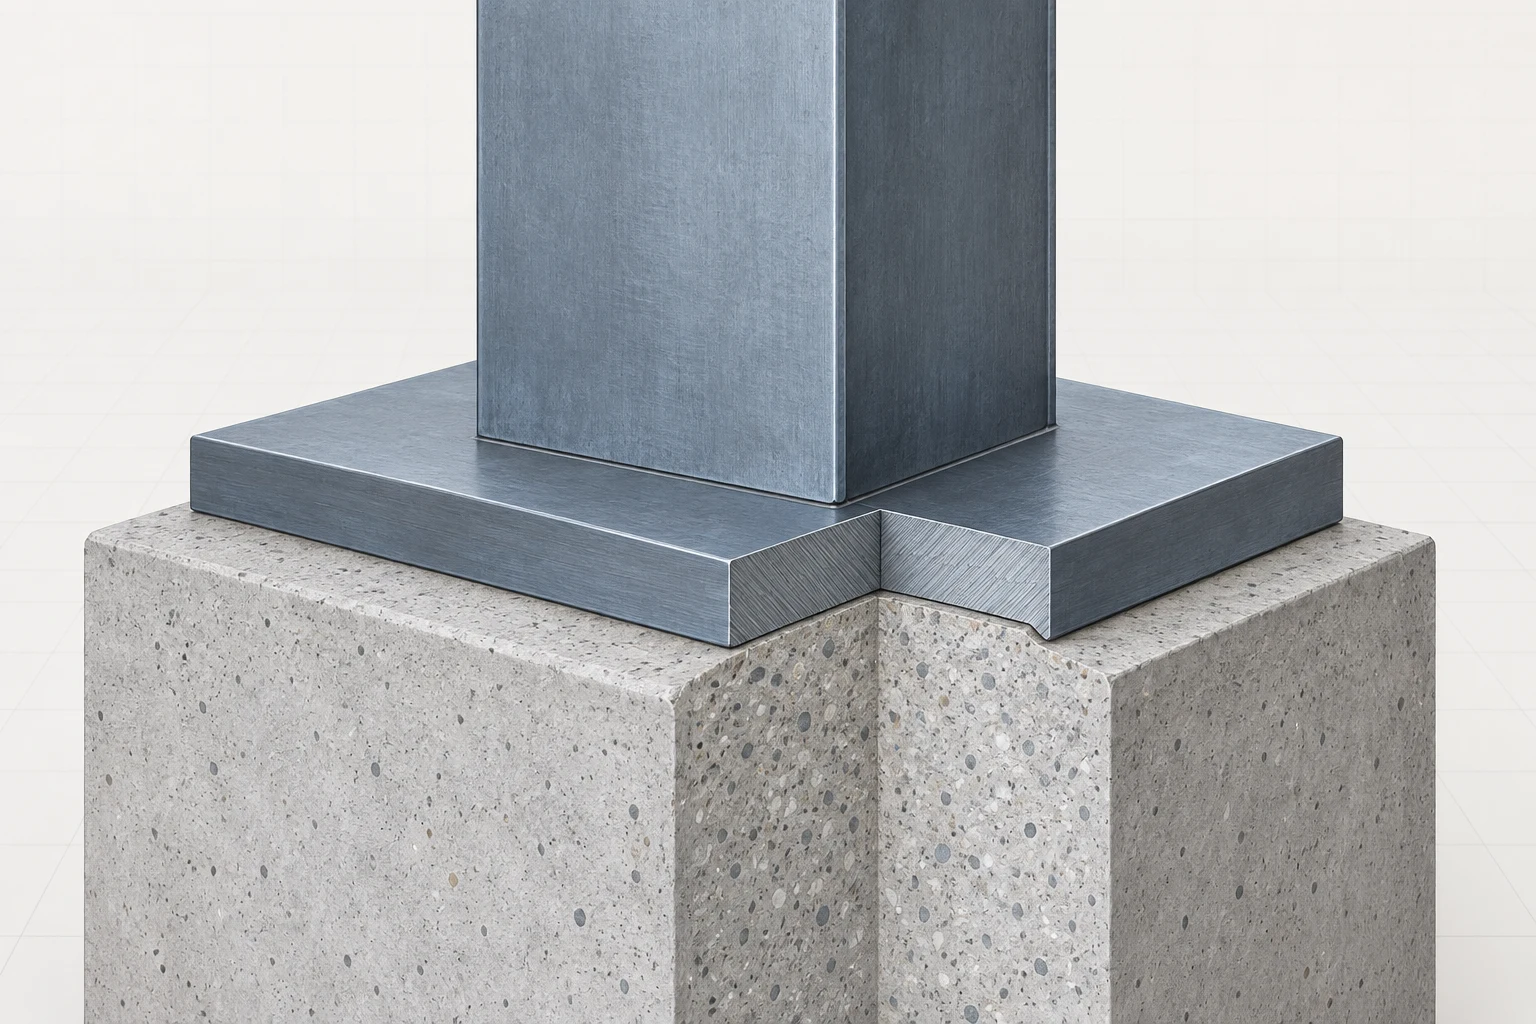
Bearing Seat Contact
The member-to-seat interface shows where compression crosses from one surface into the support; use the projected-area formula and actual geometry for bearing calculations.
Reading the Bearing Interface
The clean contact surface is the qualitative load-transfer region between the member and its seat. It does not show a pressure distribution, code detail, or bearing value; evaluate the actual contact geometry and material assumptions separately.
Saint-Venant's Principle
Highly localized stress disturbances caused by load application, holes, sharp transitions, or concentrated contact decay with distance from the disturbed region. Average-stress equations are therefore useful for global member checks, but they do not predict local peak stresses at discontinuities.
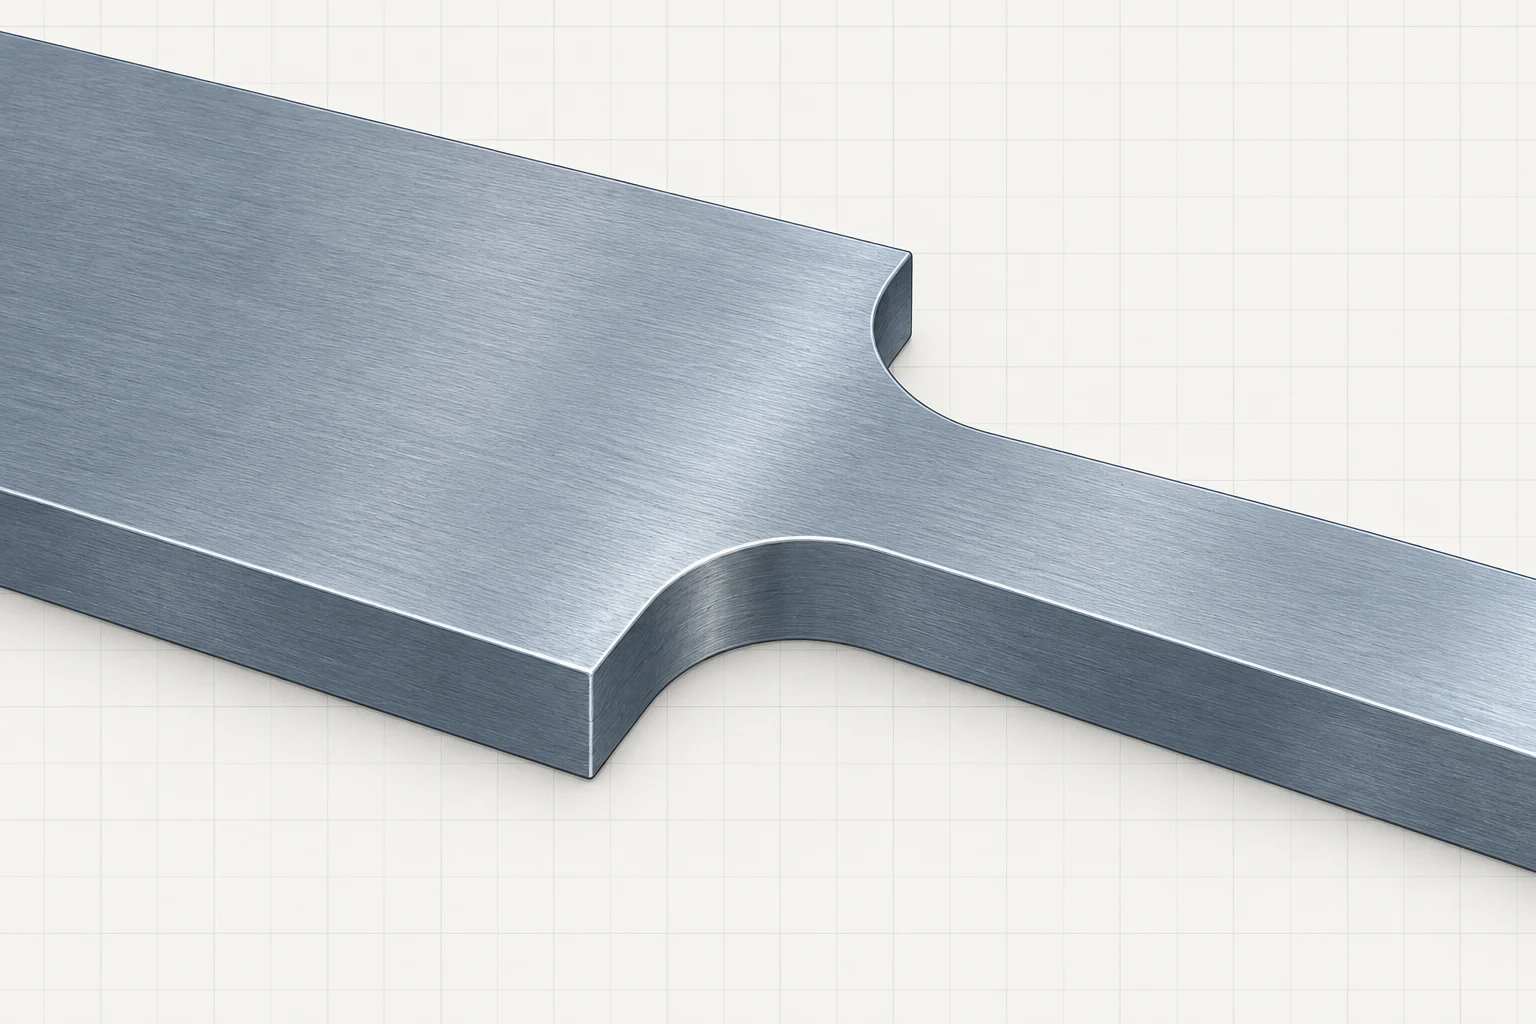
Notch and Fillet Geometry
The continuous plate makes the local geometry change visible; use the adjacent caution and a suitable concentration model when peak stress matters.
Reading the Notch Geometry
Rounded transitions and notches change the local path through a member even when an average-stress equation remains useful away from the feature. This context image does not provide a contour plot, concentration factor, crack, or failure prediction.
Average Stress Is Not Peak Stress
Do not use or to estimate local stresses beside holes, notches, weld toes, re-entrant corners, or other stress raisers. Those regions require a suitable stress-concentration model or a more detailed analysis.
Thermal Stress
Thermal stress develops when free thermal expansion or contraction is restrained.
Fully Restrained Thermal Stress
Elastic thermal stress for a uniform temperature change under complete axial restraint.
Thermal Restraint
A freely expanding member develops thermal strain but no thermal stress. Full restraint suppresses that deformation and produces stress. Partial restraint requires compatibility between thermal movement and the surrounding structural system.
Free and Restrained Thermal Movement
Compare the visible sliding clearance in the upper state with the captured ends in the lower state; the adjacent text explains why restraint changes the stress outcome.
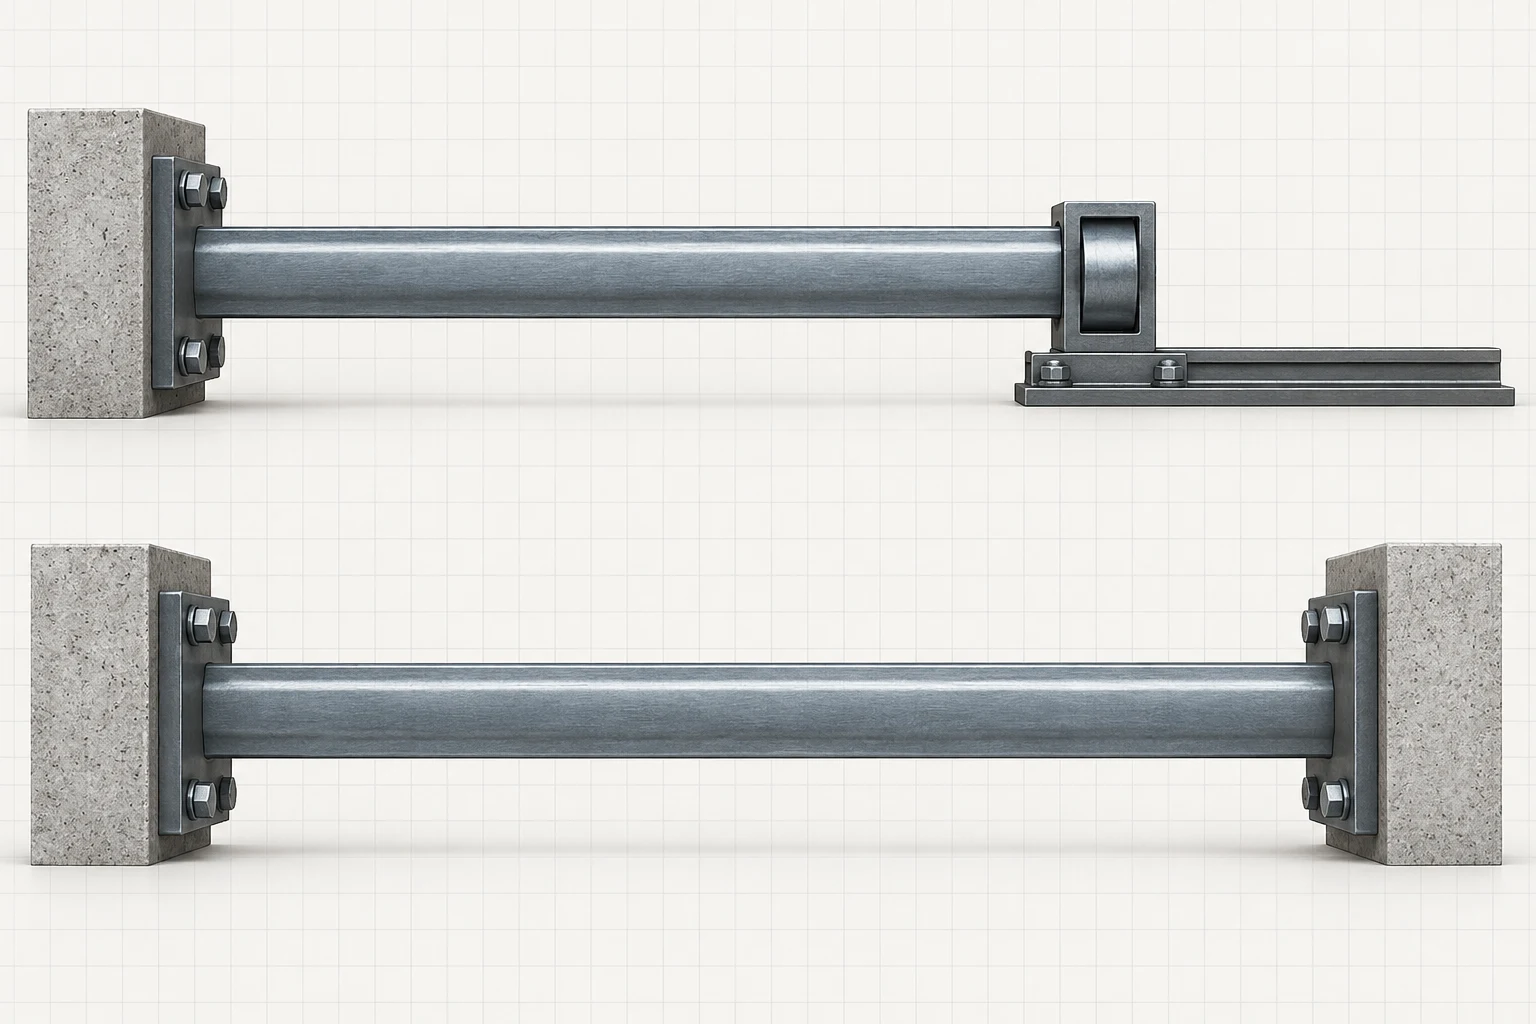
Reading the Thermal States
The upper member has room to move at its guided end, while the lower member is captured between rigid stops. The raster is a qualitative boundary-condition comparison; it does not show a temperature change, deformation scale, or computed stress.
Allowable Stress from Factor of Safety
Simple allowable-stress relationship used for introductory strength checks.
Strength and Factor of Safety
The strength basis must match the material and failure mode being considered. Ductile materials are commonly checked against yielding for basic elastic design, while brittle-material checks may be governed by ultimate tensile or compressive strength. The factor of safety represents uncertainty and required margin; it is not a substitute for a governing design standard.
- Use the actual resisting area and the correct number of shear planes.
- Average direct-stress equations are global models and do not capture local stress concentrations.
- Restrained thermal deformation produces stress; free thermal deformation does not.
- Stress varies linearly with applied force and inversely with resisting area.
- Strength comparison requires a clearly stated strength basis and factor of safety.